Three Way SLI and Quadfire Benchmarks (2010).
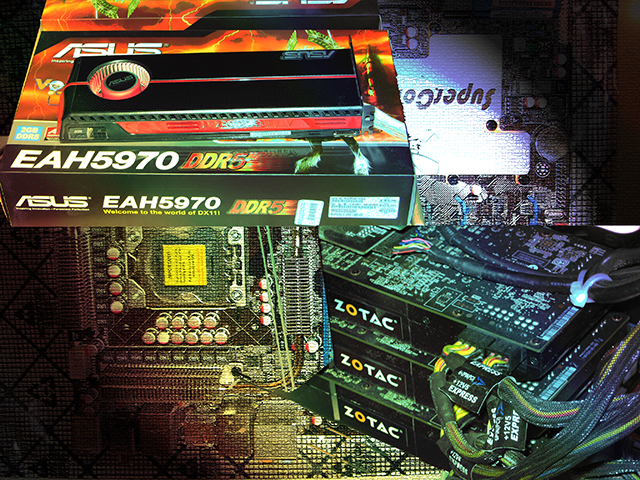
Welcome to a detailed comparison of two enthusiast grade video card configurations. The first features three Nvidia GTX 580s running in tri-SLI, while the second includes a pair of ATI Radeon HD 5970s setup to operate in crossfire. This extensive analysis is intended to show how both platforms perform in a series of individual tests made up of synthetic and game specific benchmarks.
At the time of testing, the most popular resolution for high quality gaming was 1920×1200 hence, that was the sole resolution applied throughout this comparison. It is however worth noting that a significant portion, indeed, perhaps the majority of those with high-end graphics subsystems such as these will now either be using the highest 16:10 resolution commonly available on a single screen (2560X1600) or will have invested in additional monitors in order to take advantage of the multi screen gaming technology presently offered by Nvidia’s “3d Vision Surround” or ATI’s “Eyeinfinity”. Therefore, it is also important to briefly raise the much debated issue of “bottlenecking”, a process which occurs when the performance of a faster component (in this case the video cards) is directly or indirectly compromised by a slower one (in this case the CPU).
Even at the relatively high resolution used during these tests, symptoms of bottlenecking were vividly evident, several results obtained from both setups showed little or no frame rate discrepancy, an obvious and well documented indication of the CPUs inability to keep up, this was especially noticeable when the default settings were engaged in either the application or video card’s control panel. To lessen the effect and force the graphics cards to do as much work as possible at the chosen resolution, all of the tests were rerun using alternate settings for visual quality, or “eye candy” as it’s known in the trade! When seeking to increase visual quality, two options are called upon above all others, Anti aliasing, to blend jagged edges and Anisotropic Filtering, to enhance the appearance of textures Where made permissible by the application, the following profiles were used:
Low Quality – 1920×1200 – 0x aa and 0xaf– This is the default profile with both anti-aliasing (aa) and anisotropic filtering (af) disabled and thus, the lowest quality.
Medium Quality – 1920×1200 – 4x aa and 16xaf – This profile has anti-aliasing set to 4x (4 samples) and anisotropic filtering set to 16x, the maximum currently possible.
High Quality- 1920×1200 – 8xaa and 16xaf – The third profile has anti-aliasing set to 8x while anisotropic filtering remains at 16x.
If one or more of the above was not enforceable in a particular benchmark, initially within the software’s configuration options or failing that, via the video card’s control panel, the test was skipped and/or a “best match” alternative was run it its place. Two such examples were 3dMark Vantage, where only the “extreme” test was run, which enables 4xaa and 16xaf by default and Aliens vs Predator where it was not possible to disable Anisotropic filtering, hence the low quality profile was amended to 0xaa and 16xaf.
A couple of further points regarding the test configuration. For reasons beyond my control, by the time the Nvidia cards came into my possession, I no longer had access to the 5970s. At the time of testing the ATI cards, the latest stable driver available was the Catalyst 10.7 package, which was released in August of 2010. The GTX 580 emerged in mid November and its launch coincided with Nvidia’s 262.99 WHQL driver, the first to officially support the card. Had both setups been tested and analyzed simultaneously, the ATI platform would have used the Catalyst 10.11 drivers, which may well have yielded superior results to those observed in this review though I would hasten to add, probably not enough to tip the balance in tests where Nvidia holds a commanding lead. Those wishing to decisively research such an assertion are most welcome!
For each test, where possible, the minimum, average and maximum frame rates were recorded and have been included in the accompanying bar graphs for reference. The two most important figures are those for the minimum and average framerates since it is these that have the biggest impact on user interaction and ultimately determine a smooth, responsive and enjoyable gaming experience or one riddled with choppiness and frustration.
Test System Configuration.
– Asus P6T7 Supercomputer.
– Intel Core I7 980X 3.33ghz (stock speed with Intel Turboboost enabled).
(2x in RAID 0 array, 2x non-RAID. Game installed on RAID array).
– Drivers, 262.99 Nvidia Forceware and ATI Catalyst 10.7 , both official releases.
– 6GB Kingston HyperX 1866mhz (clocked at 1333mhz, latency 9-9-9-24).
– Silverstone Strider 1500w.
– 4x Samsing SSDs – Pb22-J 256GB.
– Auzentech X-Fi Home Theatre HD.
– Windows 7 x64.
All cards run at their default “stock” speeds.
Test 1. 3dMark Vantage “Extreme” Benchmark.
3 Way SLI GTX 580 vs. Crossfire HD 5970 - Vantage
Get the Flash Player to see this player.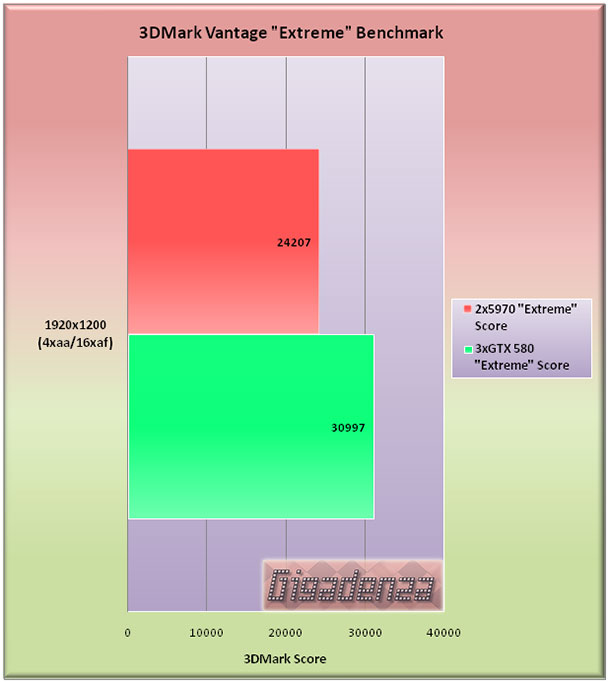
The 580s hold a significant lead in both tests and turn in an overall score that is almost 30% higher relative to ATI’s pairing. Moreover, in the Calico test, stuttering is far more evident with Quadfire despite the average framerate being in excess of 60 frame per second. The cause is likely to be a combination of the comparative lack of memory per GPU and the more complicated techniques adopted by the drivers when expoiting a four way GPU setup.
Test 2. Crysis “GPU” Benchmark.
3 Way SLI GTX 580 vs. Crossfire HD 5970 - Crysis
Get the Flash Player to see this player.As stated in the accompanying video, the original Crysis GPU test is far less demanding than various sections in the actual game, most notably the final chapter in “The Reckoning” where the player encounters the Alien Exosuit for the second time.
From these results, we can see that both setups manage impressive framerates for all three quality profiles. It is the 580s however, that emerge victorious, with an overall performance advantage of 26%, this figure is based soley on the “average” framerates obtained for each of the three runs.
Test 3. Crysis Warhead “Ambush” Benchmark.
3 Way SLI GTX 580 vs. Crossfire HD 5970 - Crysis Warhead
Get the Flash Player to see this player.The Warhead benchmark is significantly more demanding, despite this, the 580s turn in almost identical results for all three runs whilst firmly pointing a finger at the CPU and yelling,
“Any chance of us getting out of third gear?!”.
In contrast, the 5970 exhibit a performance drop off as we move up through the profiles. They hang fire with the 580s at low and medium quality but with maximum AA and AF applied, the memory limitations discussed come into effect, causing severe stuttering and forcing the average frame rate down to under what most would consider a satisfactory minimum of 30 fps.
I was initially very surprised at the 5970s sudden nose dive in performance and reran the test several times to ensure it wasn’t a driver glitch but the same symptoms were evident on each occasion and can be observed in the video. Excluding this particular result, there is very little to separate the two setups but ultimately, the 580s attain an overall lead of 30%.
Test 4. Battleforge “Lost Souls” Built-in Demo.
3 Way SLI GTX 580 vs. Crossfire HD 5970 - Battleforge
Get the Flash Player to see this player.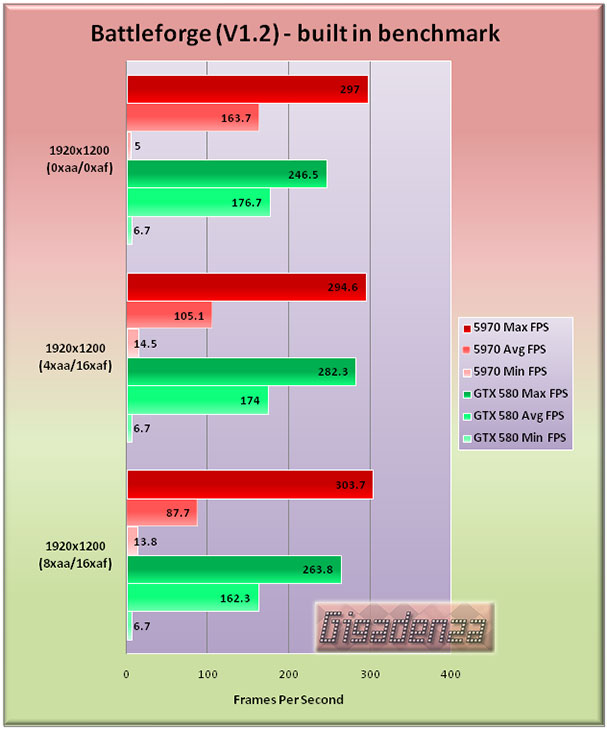
Released in early 2009, Battleforge was one of the first games to offer support for DirectX 11 and is still an exceptionally rigorous challenge for both cards under review here.
Please note that maximum and minimum frame rates are especially misleading in this test since, as the video demonstrates, the FRAPS counter suggests that they occur during the loading screen rather than the actual benchmark.
The 580s truly shone in all three runs, comfortably sustaining an average frame rate in excess of 150 fps and exhibiting virtually no decline in performance as visual quality was increased .
The 5970’s were only able to trade blows without AA and AF, after which they fell dramatically behind, though unlike in Crysis Warhead, the lack of memory per GPU did not prove to be a spoiler and the action remained perfectly smooth. Overall, Nvidia’s winning margin for this test is the largest yet observed, an impressive 44%.
Test 5. Just Cause 2 Built-in Demo.
3 Way SLI GTX 580 vs. Crossfire HD 5970 - Just Cause 2
Get the Flash Player to see this player.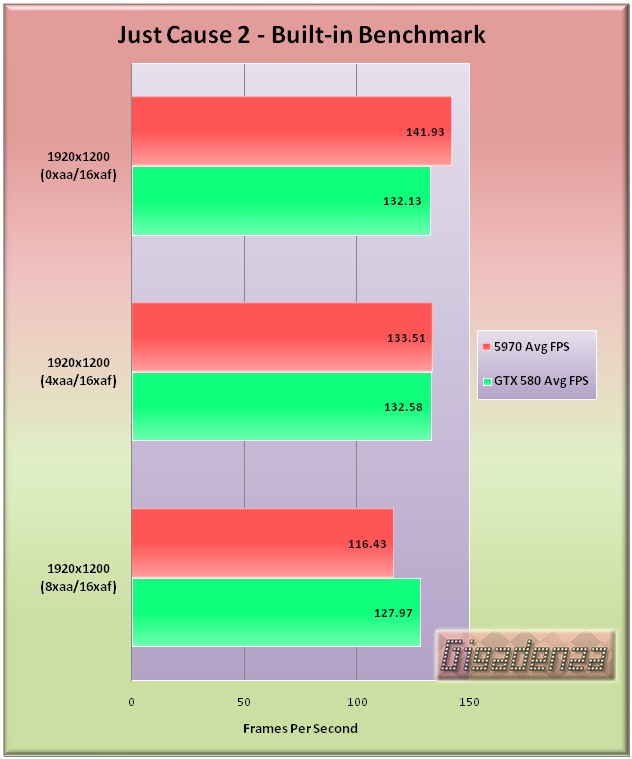
In Just Cause 2, both cards generate some staggeringly high frame rates and bring our most closely contested result thus far. The 5970s edge out Nvidia’s trio in the low and medium quality tests, though in the latter case, there is barely a frame to separate them. The 580s got their revenge in the high quality run, again proving their superior ability to handle AA and AF. Overall, it is technically Nvidia that claims victory with a 0.2% advantage though in a moral war, this could pass as a dead heat.
Test 6. Dirt 2 Built-in Demo.
3 Way SLI GTX 580 vs. Crossfire HD 5970 - Dirt 2
Get the Flash Player to see this player.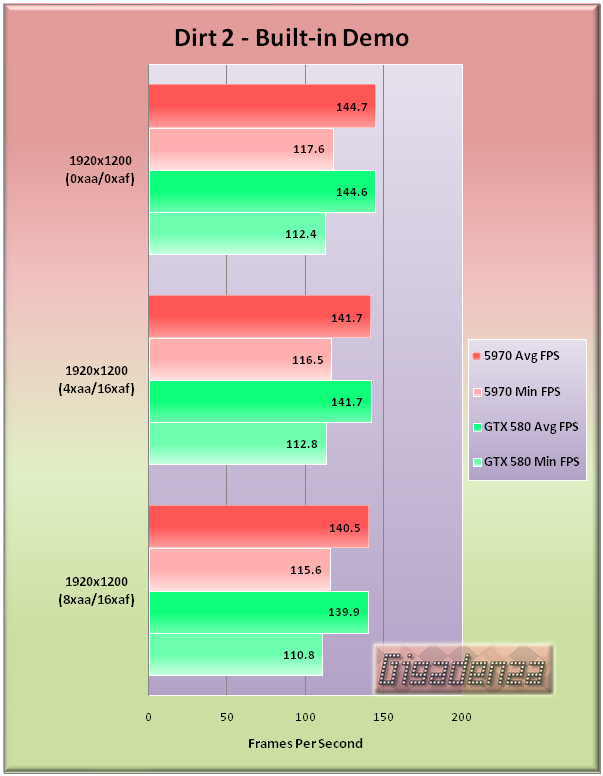
With Dirt 2, we have either another demonstration of the CPU dictating performance, or extremely impressive scaling when it comes to visual enhancements. In contrast to Crysis Warhead, where the 580s took a commanding lead as the quality was increased, here, it is ATI that manages to consistently nose in front.
No results for maximum frame rates are provided in this benchmark but the 5970s marginally higher minimum frame rate – frequently an Nvidia specialty – is worth noting, even if without the figures to hand, it would be all but impossible to distinguish between them. Nevertheless, it is the red team that emerges with a 0.16% advantage.


