The “Kepler” Rides Out – The Benchmarks.
So, here we go again!
Not having access to an HD 7970, I’ve decided that this particular series of benchmarks will focus primarily on comparing the GTX 680 with the card it is intended to displace, its older sibling, the 580.
Having three cards available in each case will also allow us to determine scaling efficiency and thus, whether or not investing in a two or three way SLI setup will yield a worthy performance gain.
Where the data is available, I will also include results from tests conducted on AMD’s HD 6990 in both single and crossfire configurations. Please note that these sets of figures – some of which have been featured in earlier articles – were obtained using older drivers than those available from AMD at the time of writing.
Had both setups been tested simultaneously, the AMD cards would have used the Catalyst 12.3 drivers, which may well have generated superior results to those observed here, though probably not enough so to turn the tables in tests where Nvidia holds a commanding lead.
Test System Configuration.
– Asus P6T7 Supercomputer.
– Intel Core I7 980X 3.33ghz (stock speed with Intel Turboboost enabled).
(2x in RAID 0 array, 2x non-RAID. Game installed on RAID array).
– 6GB Kingston HyperX 1866mhz (clocked at 1333mhz, latency 9-9-9-24).
– Silverstone Strider 1500w.
– 4x Samsing SSDs – Pb22-J 256GB.
– Auzentech X-Fi Home Theatre HD.
– Windows 7 x64.
– Dell 3008WFP 30″ Monitor and 3x Dell U2410 24″ for multi-screen tests.
All cards run at their default “stock” speeds.
Drivers
ATI Catalyst 11.3 (for the HD 6990)
Nvidia Forceware 270.61/296.10 (for the GTX 580)
Nvidia Forceware 301.10 (for the GTX 680)
All official/WHQL releases.
Each of the tests was run using three resolutions and three alternate settings for visual quality for each resolution. When seeking to improve visual quality, two options are called upon above all others, Anti aliasing, to blend jagged edges and Anisotropic Filtering, to enhance the appearance of textures. Numerous additional options for fine tuning “eye candy” are offered by both ATI’s and Nvidia’s driver software, though since most are specific to one or the other, these were not employed during testing.
Where made permissible by the application, the following profiles were used:
- Low Quality
1920×1200, 2560×1600 & 5760×1200 (multi-screen) – 0xaa and 0xaf.
This is the default profile with both anti-aliasing (aa) and anisotropic filtering (af) disabled and thus, the lowest quality.
- Medium Quality
1920×1200, 2560×1600 & 5760×1200 (multi-screen) – 4xaa and 16xaf.
This profile has anti-aliasing set to 4x and anisotropic filtering set to 16x, the maximum currently possible.
- High Quality
1920×1200, 2560×1600 & 5760×1200 (multi-screen) – 8xaa and 16xaf.
The third profile has anti-aliasing set to 8x while anisotropic filtering remains at 16x.
Settings for both AA and AF were initially applied within the application or benchmark, if either of these options was not available, they were selected in the driver software’s control panel. All other settings were left at their driver defaults.
If one or more of the above profiles was not enforceable in a particular benchmark, either via the video card’s control panel or within the software’s configuration options, the test was skipped and/or a “best match” alternative was run it its place.
For each test, where applicable, the average frame rates were recorded and have been included in the accompanying bar graphs for reference.
Test 1 – 3DMark 11
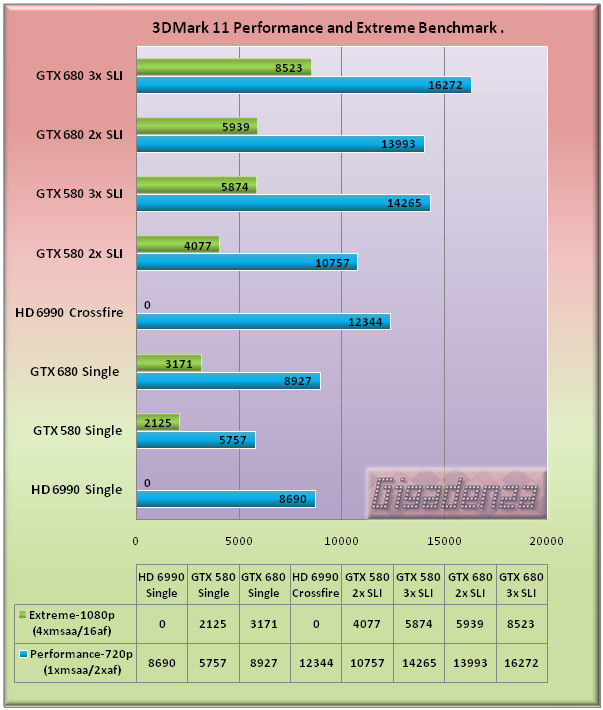
Since 3DMark Vantage is beginning to struggle to fully exploit the processing power offered by the latest multi-GPU setups, 3dMark 11 will, this time around, be included in favor of the former.
Unfortunately, there was no chance to conduct the “Extreme” benchmark on the HD 6990 but in examining the results it remains apparent that Nvidia’s quest for energy efficiency has in no way led to a compromise in performance. Just look at that! Even a single gtx 680 is enough to nose ahead of AMD’s dual GPU monster, which itself consumes over 150 watts more under load.
With the scores being so close, we must consider that the use of AMD’s most recent drivers might well have influenced a different result and that the absence of the HD 7970 from these tests is making Nvidia’s first 28mn card appear especially economical on power. Nevertheless, this is a very inspiring start for the GTX 680, whose score in 2 way SLI is virtually equal to that of three 580s in the “performance” benchmark and fractionally higher than the latter in the “Extreme” test.
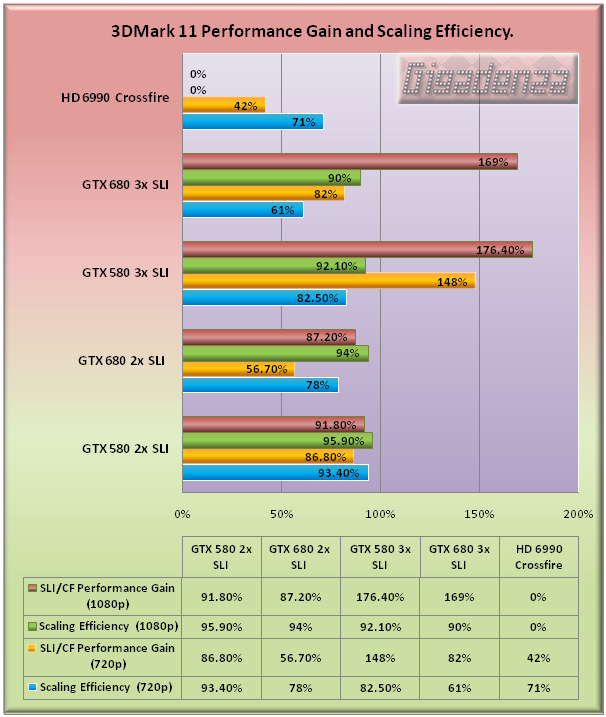
I wonder how long it will be before 3dMark 11 can’t prevent video cards from forming a disorderly queue behind the CPU. There are certainly early warning signs in the “performance” test with two 680s yielding only a 56.7% gain in comparison to the 86.8% increase afforded by adding a second 580. This conservative bonus is reflected in the 680’s scaling efficiency, which is lower than the 580 in both 2 and 3 way SLI, despite significantly higher scores in all the tests.
However, as soon as we switch to the “Extreme” benchmark, the 680s are assigned a workload worthy of their capacity and exhibit the same breathtaking performance boosts and scaling as the 580s.
Test 2 – Lost Planet 2
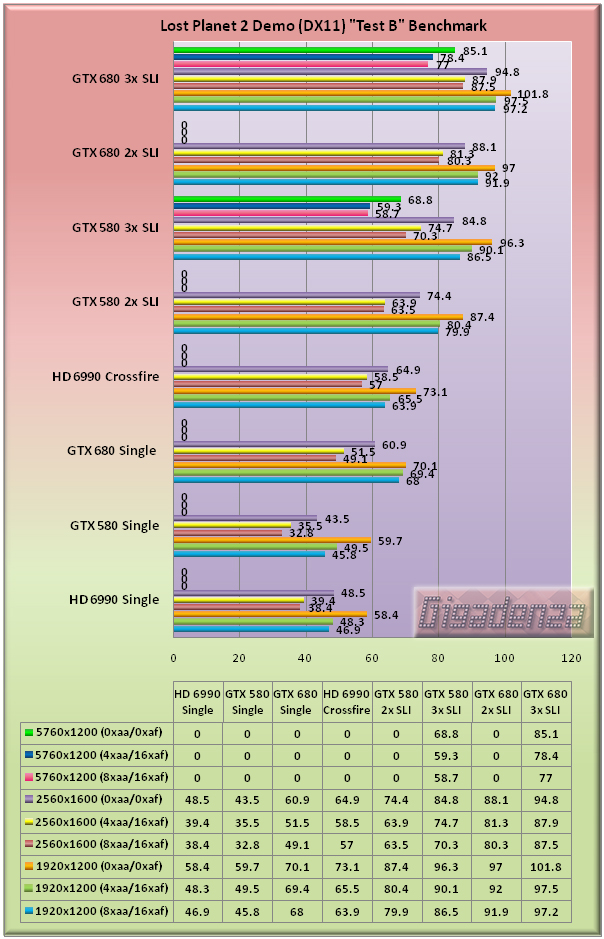
Lost Planet 2 provides two graphically arduous tests enriched with numerous DirectX 11 specific routines including advanced shading techniques, highly detailed texturing and abundant tessellation. Here we focus exclusively on test B, the one with the massive, crawly thing!
Quite a lot of information to digest! The multi screen tests at 5760×1200 would have been possible on a single HD 6990 and 680 though for the 580, a minimum of two cards is required. As there was no opportunity to obtain results from the 6990 at this resolution, only the 580 and 680 were bench marked and in each case, to keep things consistent, only in 3 way SLI.
Once again, a single GTX 680 has the legs on a 6990 and this time by a comprehensive margin, regardless of the resolution or quality enhancements. It also improves greatly on the 580’s performance, with a notably increasing lead as we move from 1920×1200 to 2560×1600 and/or apply eye-candy. Also note the consistent edge that two 680s have over three 580s.
One less card, considerably less electricity, yet superior performance. Mission accomplished Nvidia.
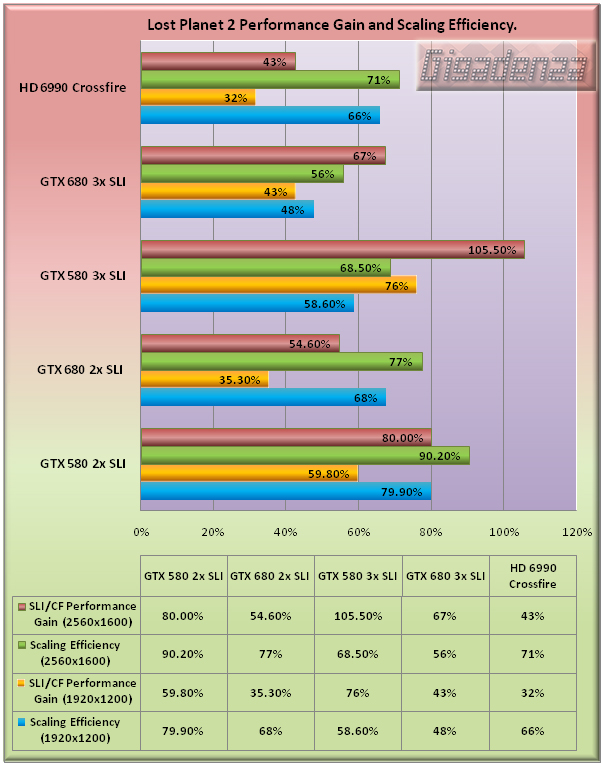
Oh dear me. THIS IS TOO EASY! GIVE US SOMETHING HARDER! Yelled the frustrated little video cards as the old CPU huffed and puffed. There can be no doubt that in this case, a resolution of 1920×1200 was simply not enough to adequately exploit the power of two 680s in SLI. Only 35% more speed with a scaling efficiency of 68%. By contrast, look at how much harder a pair of 580s were working at the same resolution, around 12% per card, resulting in a much healthier performance increase of 59.8%.
Moving up to 2560×1600 gives us a stronger reason for investing, a speed gain of over 50% with each card flexing 77% of its muscles.
With three 680s, even at 2560×1600, you only get around 13% more speed than with two, which for an additional £400, is surely impossible to justify. Had the test system featured an insanely overclocked Sandybridge-E CPU such as the 3960X instead of the stock 980x I had available, the benefit of SLI would have undoubtedly been more significant. However, I still question whether three cards offers a worthy advantage to any other than those looking to unite them with a multi-screen setup.
Test 3 – Crysis Warhead.
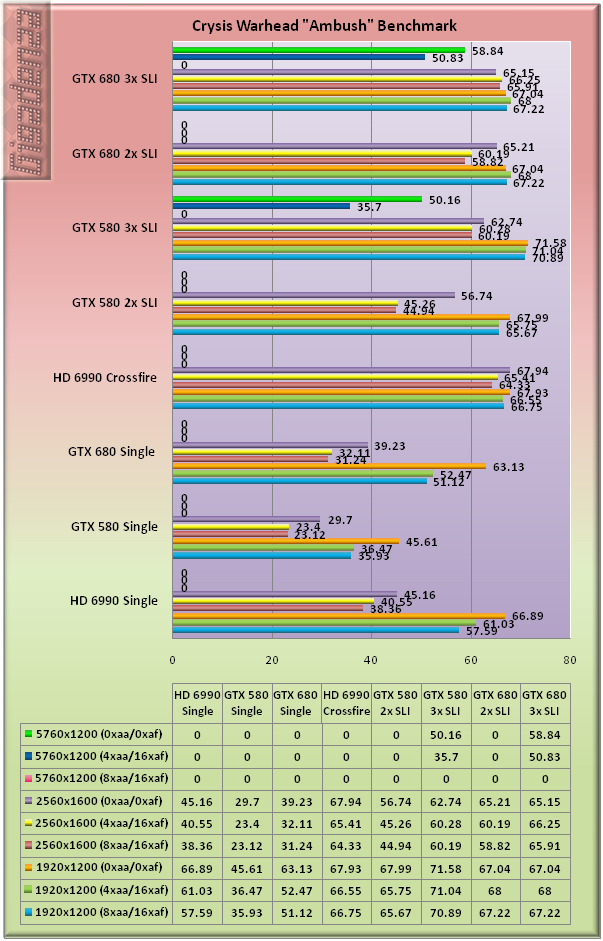
As the slicker, better looking and less bug ridden follow up to Crysis – a game which became infamous for bringing the most explosively powerful PCs to their knees – Crysis Warhead is one of only two directX 10 titles to feature in this review. Using version 0.40 of the Framebuffer Benchmark Tool, 3 loops of the “Ambush” run were completed in each test.
Once again, it would appear that the lower resolution of 1920×1200 will only force a single card to break sweat. A much better showing from the 6990 here, which moves ahead of the 680 and increases its lead when we switch to 2560×1600.
In SLI and Crossfire, no matter how much eye-candy we apply at 1920×1200, all three cards hit a brick wall (in the form of the CPU) at around 67-70 frame per second. The 6990s in Crossfire continue to impress, retaining a lead over both pairs of Nvidia cards – albeit a very narrow one in the case of the 680s – and exhibiting virtually no loss of pace at 2560×1600 irrespective of quality. In fact, the big red cards are only just pipped by three 680s at this resolution, though the latter would almost certainly have responded more positively to a faster or overclocked CPU. Oh! And look. The performance of two 680s is once more, virtually equal to that of three 580s.
On the triple screen tests there was an issue, namely that neither the 580s or 680s were able to run the benchmark with anti-aliasing set to 8x. Any attempt to do so resulted in a crash to desktop with an error message. I tried loading the game normally, then loading a saved game (after setting aa to 8x in the options menu), same result. Driver problem? Memory leak? Who knows? Still, at least there was some data to go on. Both 3 way setups managed average frame rates above 50fps at 5760×1200 with 0xaa while the 680s continued to do so with 4xaa.
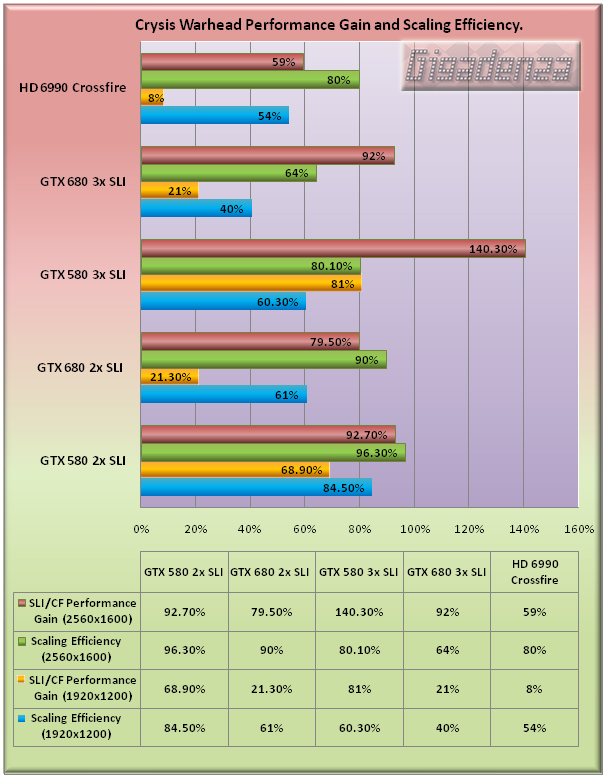
The scaling results show that the only significant benefit at 1920×1200 comes from adding a second 580, which returns a 69% performance increase. By contrast, a second 680 gives a pathetic 21% boost while pairing up the 6990 yields an almost laughable bonus of just 8%. Adding a third 580 raises the bar by just 12%, while a third 680 does nothing but twiddle its thumbs, no increase whatsoever and scaling inefficiency to match!
Climbing to 2560×1600 gives all three two card setups plenty to think about but when it comes to TRI-SLI the 580s scale better than their successors, thereby confirming the CPU as the cause of the metaphorical traffic jam.
Crysis Warhead - Dual GTX 680 vs. Dual GTX 580
Get the Flash Player to see this player.Test 4 – Crysis 2.
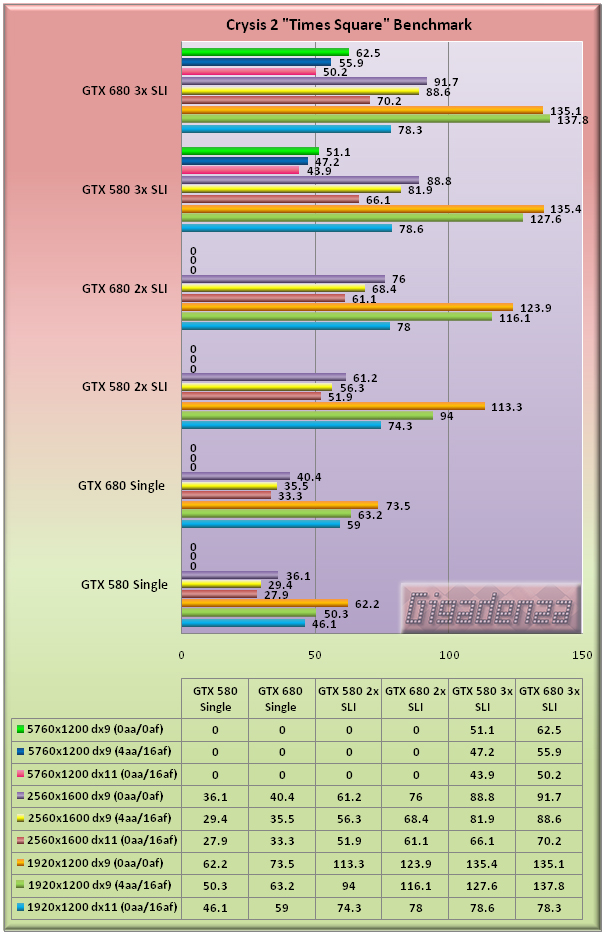
Crytek came under much criticism when it decided to release its hugely anticipated sequel bereft of support for Direct X 11, despite other major titles readily adopting it. Not much time passed before a beefy high resolution texture pack and an update exploiting DX11’s full compendium of features had made their way on to Steam’s servers. Both of these updates were installed prior to running this benchmark.
The “Adrenaline Crysis 2 Benchmark Tool” (v 1.0.1.13) was used to run three loops of the “Times Square” test with the quality set to “ultra” and “High res” textures enabled. In the tests where AA was set to 4x, “Edge AA” was set to “Edge Blur”.
As there was no option to apply 8x AA, the high quality test was run in with DirectX 11 enabled while the low and mid-quality runs were completed in DirectX 9 mode. It is not possible to enable AA in any form when running the game with DirectX 11 enforced, hence only one test was conducted at each resolution.
No chance to test the 6990 here I’m afraid, so this round becomes a straight fight between the two Nvidia cards. It’s scarcely surprising that the 680 bests its older sibling in single and two way SLI, though on this occasion, the gap is perhaps less substantial than expected, especially at 2560×1600. Adding a third card serves as proof of another interesting pattern, namely that scaling appears to be far more effective in the DirectX9 tests.
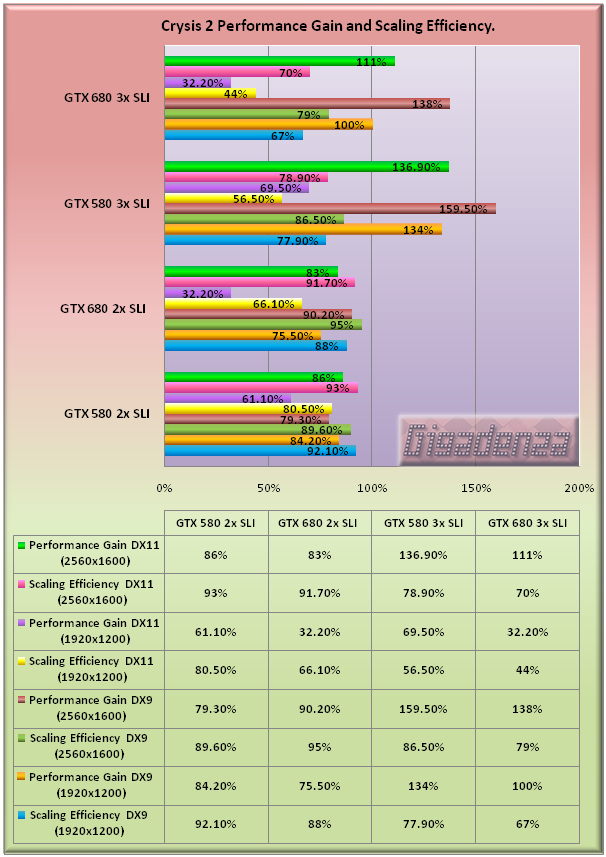
And here is further proof. Note in particular the performance gain at 1920×1200 when running two 680s, only 32.2% in the DX11 test but 75.5% in the equivalent directX9 tests, over twice the increase. Then look at what happens when we add a third 680, the gain for direcX 11 at 1920×1200 is utterly non-existent, we’re stuck at 32.2% yet with directX 9 at the same resolution, we get a 100% gain, that’s 25% higher than with two cards, not much but certainly better than nothing.
Moving to 2560x1600 yields vastly improved scaling for two way SLI in DirectX 11 and a performance gain reflecting that observed in DirectX 9, though in three way SLI, scaling is once again superior with the latter. Could this mean that Cryris 2 in its newer and apparently more graphically taxing guise is, in fact, placing a greater demand on the CPU and giving rise to yet more bottleneck-ridden frustration?
Crysis 2 - Dual GTX 680 vs. Dual GTX 580
Get the Flash Player to see this player.Test 4 – Just Cause 2.
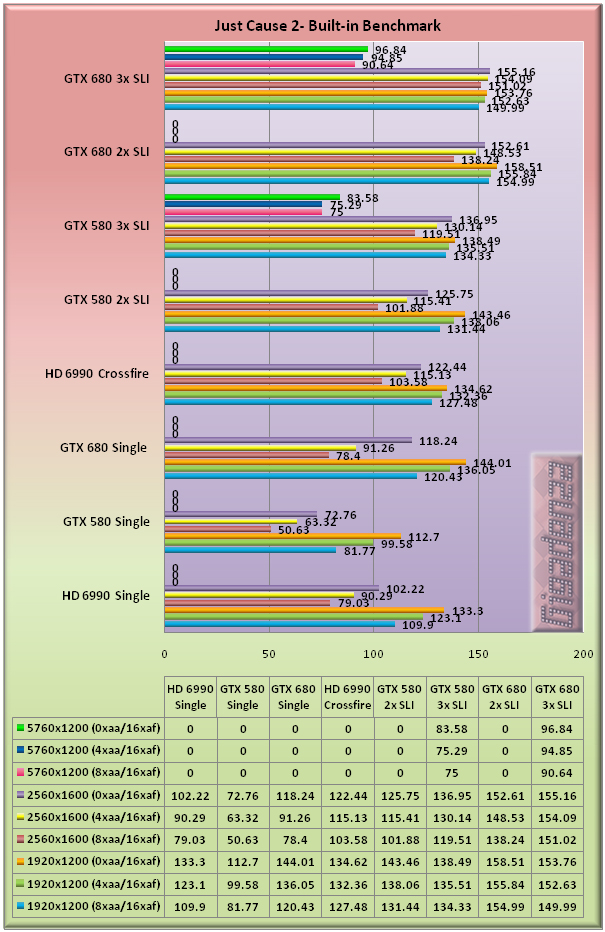
Just Cause 2’s built in benchmark moves us back into directx 10 territory and is one of the fastest to run since the game doesn’t need restarting in order to apply any of the settings. There are two options , bokeh filter and enhanced water detail, that are exclusive to Nvidia cards, both of these were disabled while all other settings were either enabled or left at their highest possible detail level.
Another victory for the 680 in singles competition, where it displays some of the most significant improvements so far. Faster overall than the 6990 and at 2560×1600, between 50 and 60% faster than its older sibling.
As we move into multi-card territory we are once again hindered by the software’s inability to provide the GPUs with enough work so as to avoid the CPU becoming the primary encumbrance. In most cases, the higher resolution of 2560×1600 is enough to shift the workload back onto the video cards. The 680s in 2 way SLI manage to overhaul three 580s while adding a third 680 will only benefit those with a triple-screen setup.
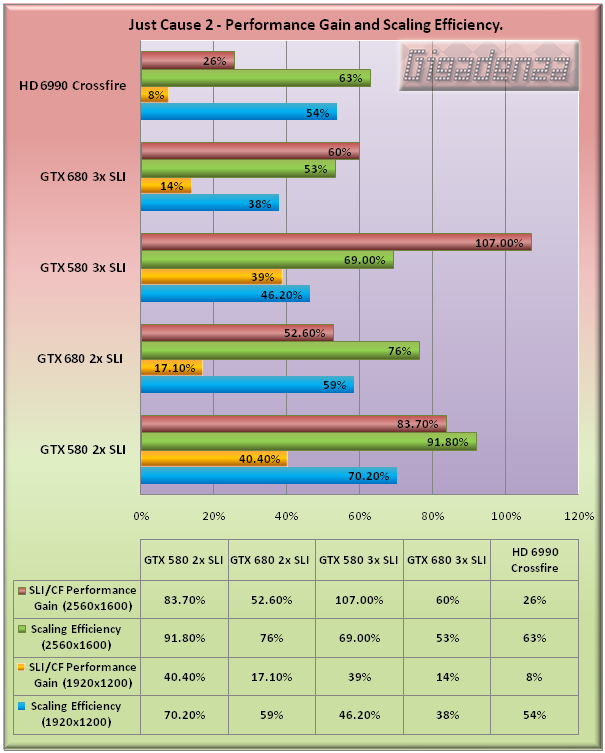
Our scaling figures confirm that, in this instance, the sweet spot for optimum performance and value is a two way SLI setup running at a resolution of around 2560×1600 (2560×1440 for 16:9 screens).
The 6990’s disappointing results can be partially attributed to a pronounced frame rate decrease towards the end of each benchmark, which lasted between 5-10 seconds. The anomaly occurred at exactly the same point on every occasion and is almost certainly driver related.
Test 5 – Battleforge Lost Souls.
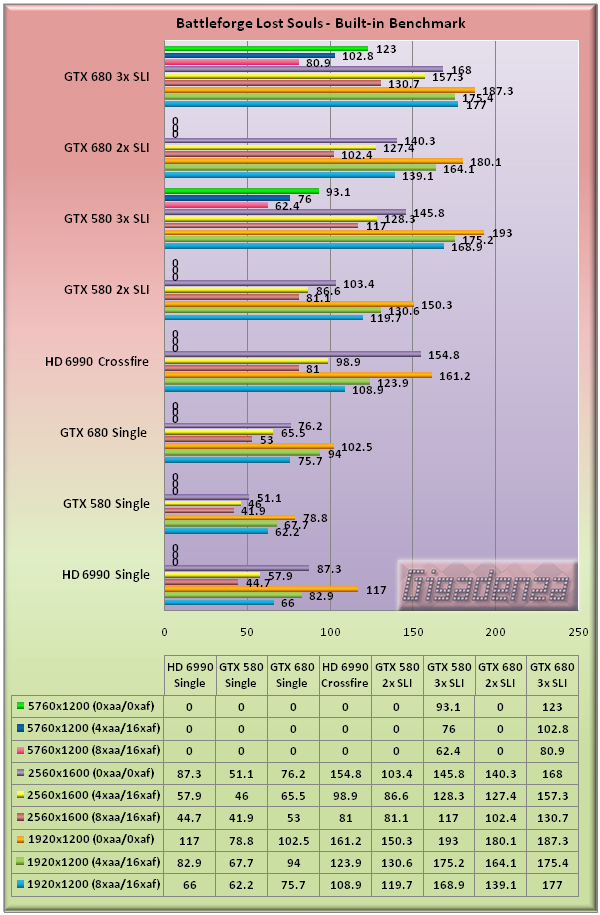
In Battleforge, one of the very first titles to make extensive use of DirectX 11’s feature set, it would appear that we finally have a benchmark worthy of these card’s silicon! Excluding the settings for AA and AF, all other options were either enabled and/or set to the highest possible detail level.
The 680 once more shows marked improvements over the 580 (as high as 50% at 2560×1600) and goes toe to toe with AMD’s monster, winning four out of six tests and demonstrating a superior ability to process eye-candy.
The pattern is repeated when we start adding cards, though the 6990s in Crossfire lose more ground to both Nvidia candidates, falling behind the 680s in five out of the six tests. On this occasion, two 680s can’t quite match three 580s while for once, a third Kepler actually yields a notable speed boost, especially at the higher resolution, though quite how many would be discerning enough to notice the difference between 100 and 130 frames per second is a matter for further debate!
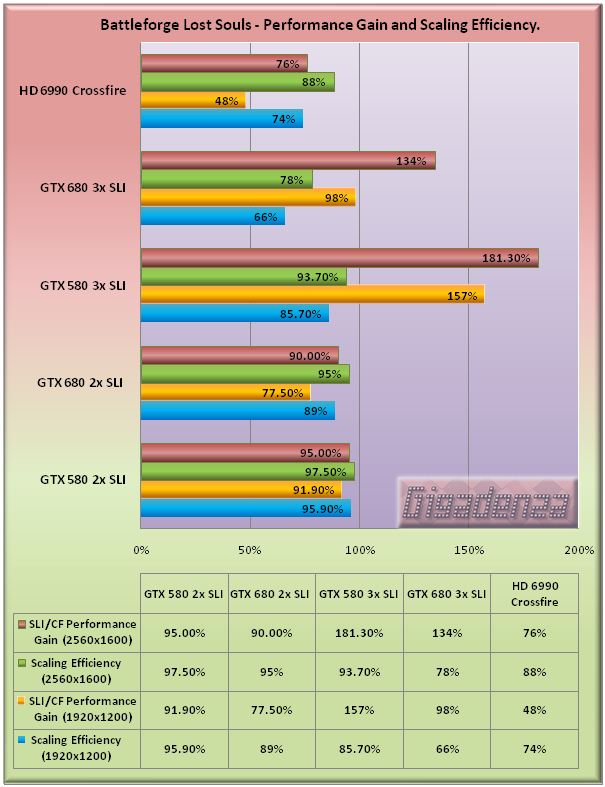
Granted, the frame rates were pointlessly high but isn’t it satisfying to see consistently efficient scaling? The only occasion that any of these setups dips below 70% of its maximum “payload” is when we have three 680s running at 1920×1200, hardly surprising considering how difficult it has become to tax these cards at the said resolution.
Test 6 – Aliens Vs. Predator.
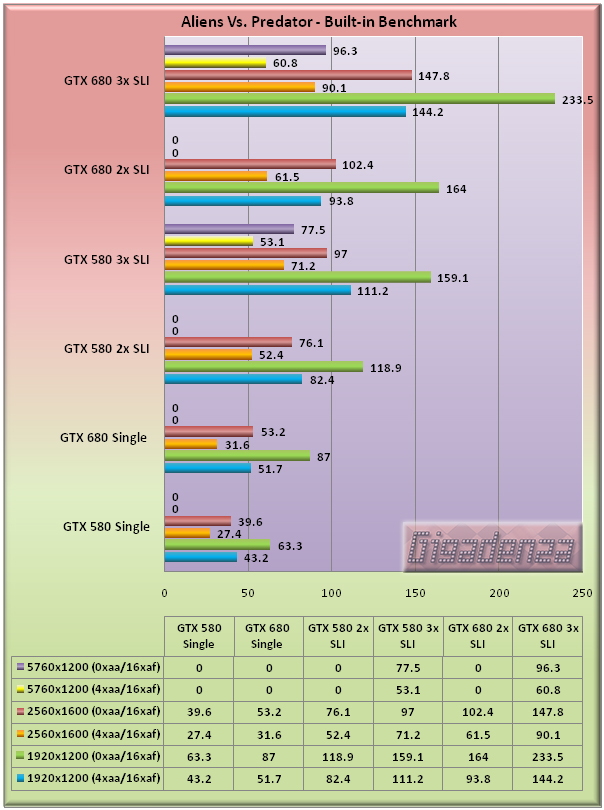
Another extremely demanding DirectX 11 game peppered with enhanced FX and tessellation. The settings for this benchmark are applied in a txt (config.txt) file prior to running. All options were enabled or set to the highest allowed, tessellation was left on and anisotropic filtering remained at x16 since there is no way to disable it.
No 6990 data this time around, so its Aliens vs. Predator and Nvidia vs. Nvidia! The 680 provides a notable improvement across the board, rising at times to 50% , though surprisingly, the margin is consistently wider when anti-aliasing is disabled. Additional cards allow the 680 to extend its lead further with very little evidence of a CPU generated pile-up. Two 680s are again trade blows with three 580s (a little faster with no eye-candy, a little slower with) and triple 680 setup keeps frame rates above 60fps, even at 5760×1200 with maximum visual quality applied, nothing if not impressive.
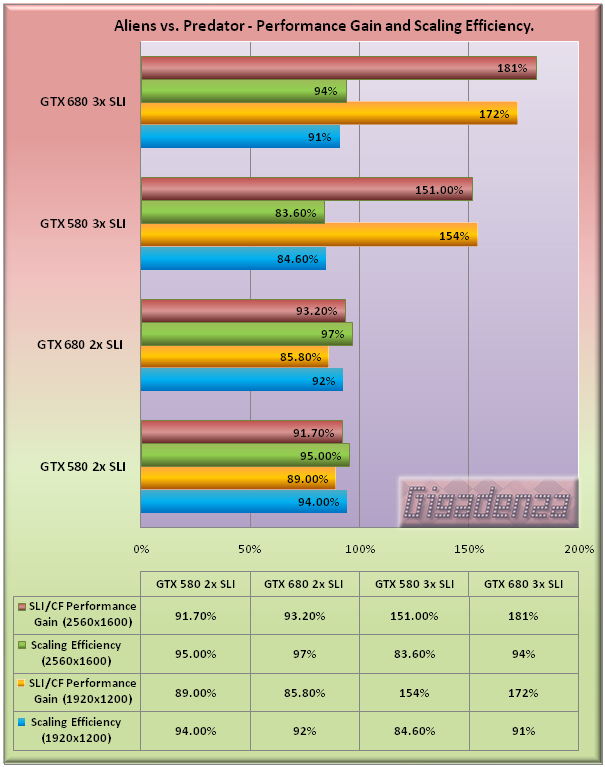
If somebody wants to try and justify investing in a 3 way SLI setup but only has a single screen on which to run it, these scaling results would be a good place to start, at least, for those who can’t settle for frame rates under 100fps ;). A possible driver-related oddity is that three 680s scaled more effectively than three 580s, a first in this series of tests.
Test 7 – Batman: Arkham City
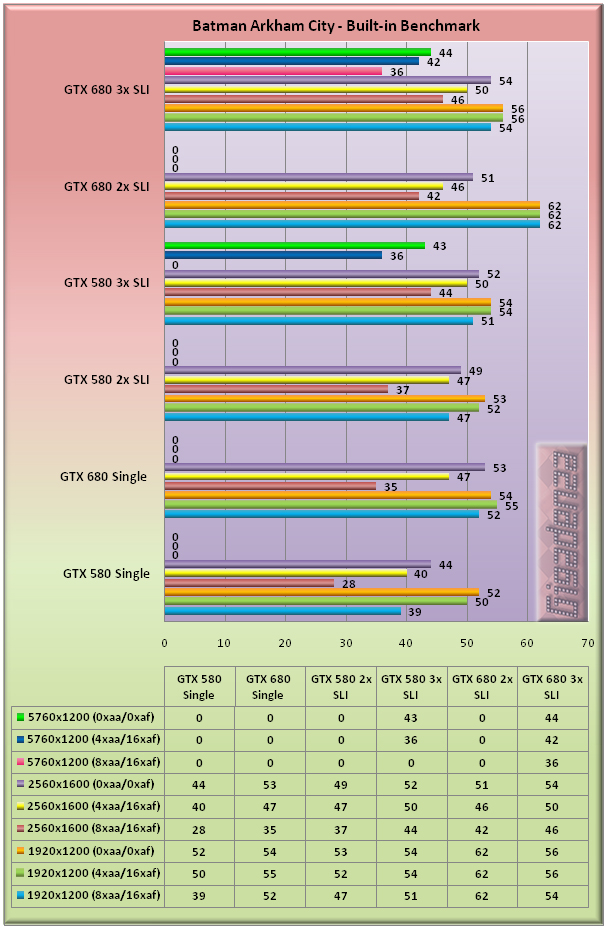
There is a very good reason why I chose to include this particular benchmark on the same page as the preceding one, becuase this is what happens when scaling goes spectacularly awry. Not since Grand Theft Auto 4, a game which was largely considered to have next to no support for SLI or Crossfire, have I experienced such a meagre return for the hardware invested.
With all of the latest patches installed and no matter how many runs were completed, the only notable, though still small, performance gains occurred when moving from the 580 to the 680, either in a single card mode or in three way SLI running on a triple screen setup at 5760×1200. Incidentally, three 580s choked when attempting to run the benchmark at this resolution with 8x applied, hence no result was posted. A lack of video RAM, 1.5gb per card compared to the 680’s 2gb, is almost certain to be the cause.
A second 680 actually resulted in a performance decrease in two of the three tests at 2560×1600 and only when AA was cranked up to 8x was any benefit observed when a third card was added . Switching off the game’s dx11 enhancements did nothing to improve matters. On the bright side, the game does at least now run smoothly with DX11 in action and even a single card will ensure perfectly acceptable frames rates.
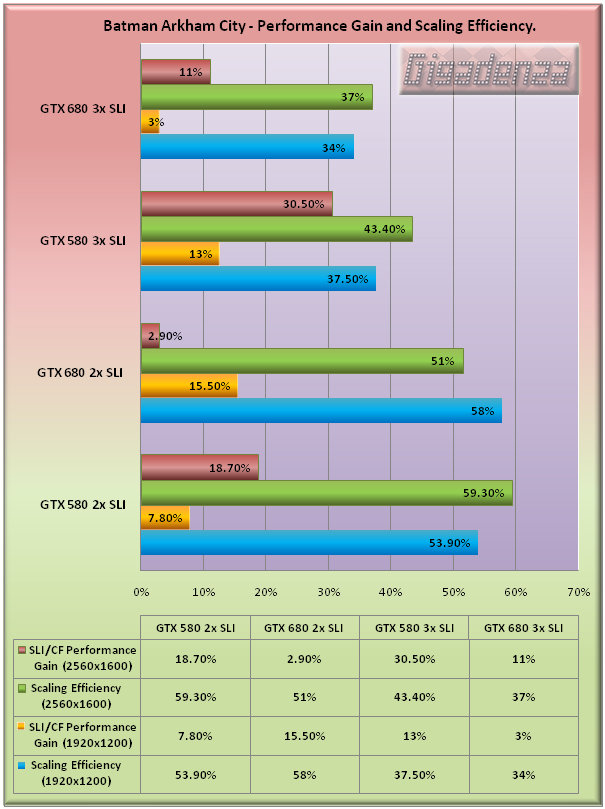
As if any further proof was needed….try not to laugh! Any chance of another patch to sort this out?
Test 8 – Unigine “Heaven” Benchmark.
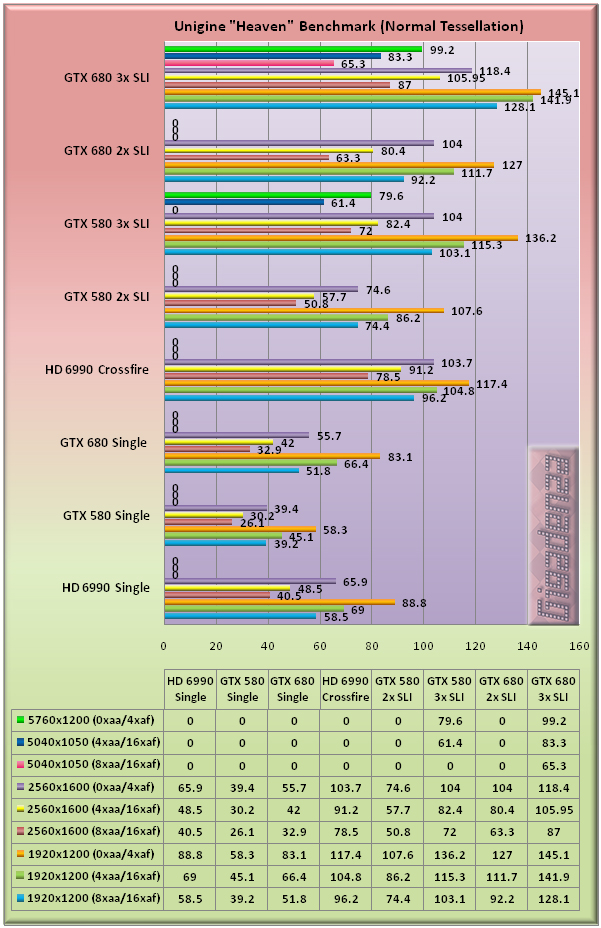
And so to a grandstand finish with our old favourite, the Unigine “Heaven” spectacular! Each loop was completed in DirectX 11 mode with shaders set to “high”. Tests were conducted first with “normal” , then “extreme” tessellation enabled.
In the “normal” test, the 680 exhibits gains over the 580 in line with those we have witnessed thus far (typically between 25 and 40%) while the 6990 returns with a bang and manages to edge out Nvidia’s new boy in singles competition. A pair of 680’s closes the gap on two 6990s in Crossfire, with the latter proving a little stronger when quality is increased. Three 580s finish ahead of two 680s, though the margin is far from considerable while a third 680 provides a respectable speed bonus, even at the lowest resolution, a testament to the challenge this benchmark contines to offer the GPU.
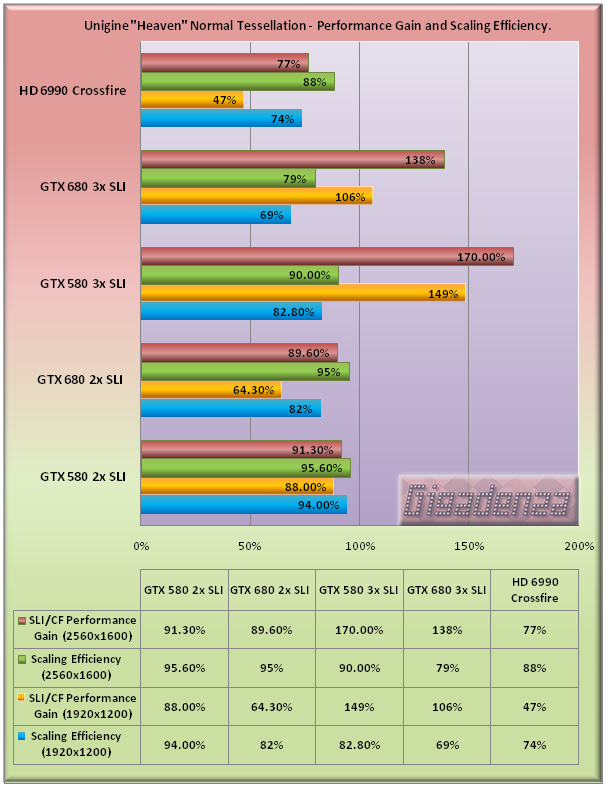
Not as impressive as AVP but certainly better than Batman! Good showing from the 6990s, especially considering the scaling issues dual GPU cards have suffered in the past. For the Nvidia cards, the sweet spot for a well balanced cocktail of value and performance is once again two way SLI but a triplet in either case does not go unnoticed.
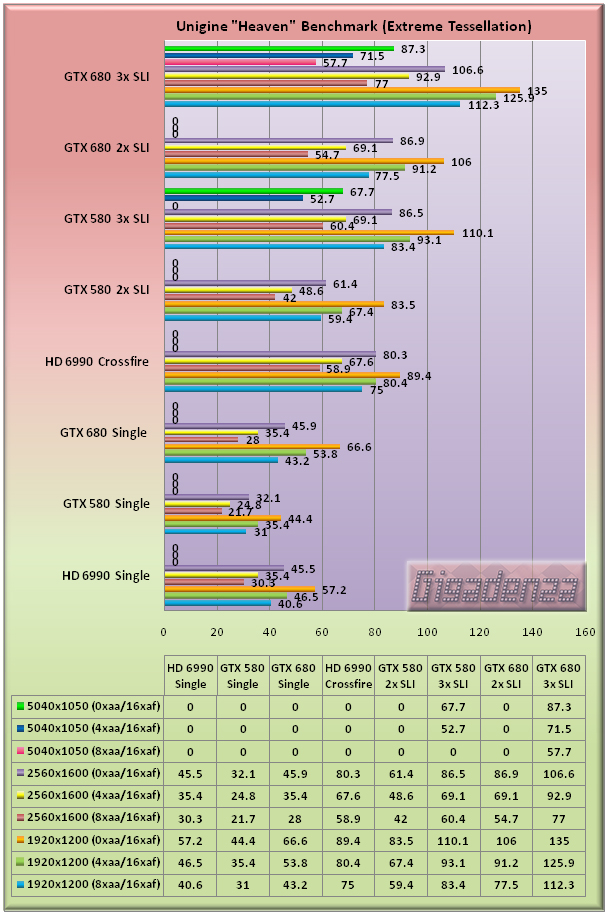
Enabling extreme tessellation hands the advantage to Nvidia. A single 680 now has a 6990 covered in four out of the six tests while the gap between the 680 and its elder remains broadly the same as with normal tessellation. The 6990s in crossfire lose a little more ground to the 680s in SLI but maintain a lead over a pair of 580s. Two 680s still can’t quite catch three 580s, again indicating that both cards handle tessellation with equal efficiency.
In the three way SLI tests, the 580s again had issues completing the benchmark at 5760×1200 with 8x AA applied while the 680s, by virtue if an additional 512mb of memory per card were able sustain a frame rate of almost 60fps.
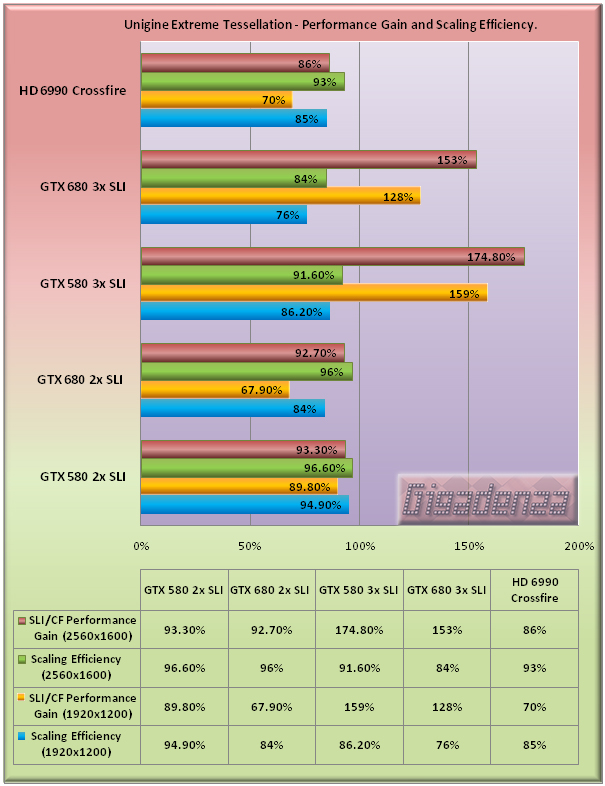
As one would expect, the performance increase generated by a second and third 580/680 is greater than with normal tessellation. The 6990 also shows improvements at both resolutions.
Conclusion.
Our story has come a long way since the beginning of March 2012, when rabble rousing rumors sufraced pertaining to the Kepler’s imimant release. Amongst these was one particularlly bold claim that suggested its power to be the equal of three GTX 580s. This has turned out not to be true, not even close. The group of benchmarks featured here might not have included such recent titles as Battlefield 3, Dirt 3, Metro 2033 and others but based on the results obtained, it couldn’t even be argued that one 680 is able to convincingly trade blows with two 580s, let alone three.
Hype surrounding AMD’s and Nvidia’s eternal quest for speed is certainly nothing new but when its so sensational and fails to take wing, it allows hordes of detractors to react with a torrent of negativity, invariably drawing much attention away from improvements and features that might have otherwise commanded universal praise.
The GTX 680 really is an excellent video card and here a some reasons why:
Its performance is significatly higher than the abdocating 580, rarely below 30% and frequently approaching 50%.
At stock speeds, its temperature did not exceed 88 degrees under load, even in three way SLI in a closed case and with its fan speed left on the default “automatic” profile. This was at least 5 degrees cooler per card than the 580.
By virtue of the above, it is noticeably quieter and quite possibly the quietest card of its generation compared to any that offer an equivalent level of performance.
It was regularly able to match and in some cases surpass the raw pace of AMD’s dual GPU 6990, a card which at the time writing was considered by many to be the fastest money could buy and consumes an average of around 150 watts more.
For those who have already opted for a 7970 or who don’t mind a slightly higher electricity bill, it is unlikely to be a justifiable purchase but owners of 480s and 580s seeking a healthy performance bonus could do a lot worse than find a new home for their old cards and use the proceeds to re-invest! If money is no object, a couple of Keplers will have nothing to fear in the current gaming climate and three of our eco-friendly pixel crunchers will see you burn through any game at any resolution with all the candy your eyes can guzzle as well as ensure that your family of 120hz 3d monitors gets a comprehensive workout.


