An “X” Rated Rumble.
3DMark 2013
A Turtle clambers languidly out of a sparkling mountain stream while a butterfly frolics amidst nearby foliage. A clan of heavily armoured soldiers crouch nervously behind banks of freight, preparing to defend their mighty space station from a satanic invasion of impregnable exo-suites and grizzly Gatling guns.
A pair of playful Will-o’-the-wisps wander through the gnarled faces of forest pines as wayward fireflies look on. A leviathan leaps from the ocean in one final, desperate bid to devour a sky bound clipper and her fearless captain. If any of these scenes sounds familiar, you are a certified 3dmark veteran.
3DMark Firestrike- Dual R9 Fury X Vs. Dual Titan X.
Get the Flash Player to see this player.
Futuremark’s crippling Firestrike demo comprised part of the company’s 2013 benchmark suite and rapidly evolved into byword throughout a voracious fraternity of elite over clockers. In keeping with the sadistic, yet thoroughly respected tradition of reducing ninja PCs to quivering mounds of render weary silicon, the test used a succession of intricately detailed graphical sequences to simulate workloads induced by the most consumptive games of the era.
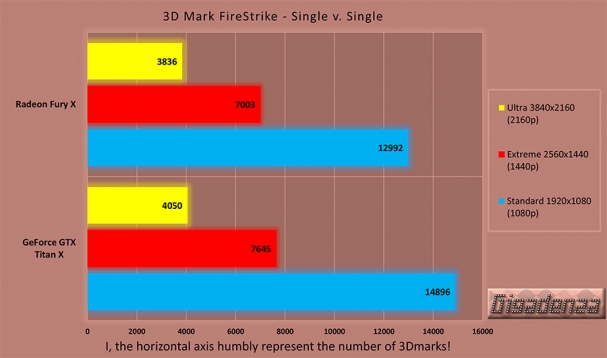
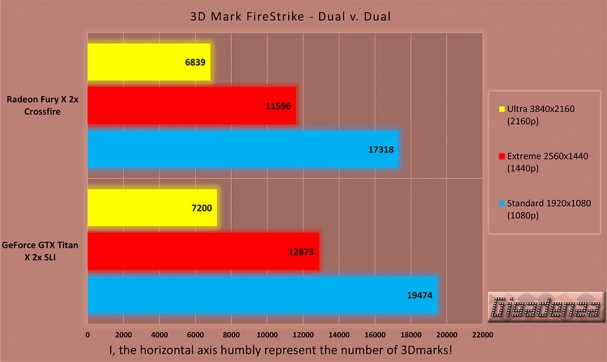
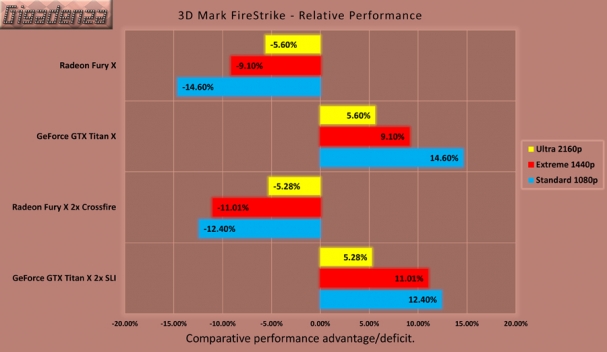
Both the Fury and the Titan acquitted themselves admirably with the NVidia’s Cuda crunching colossus creeping ahead of its hydro-assisted foe in every iteration, though even when partnered up, these staggeringly powerful GPU’s were roundly ravaged by the “ultra” tests, frequently dipping below 20fps and escaping slideshow shame by the skin of their transistors. Gaps ranged from about 12% at 1080p down to 5% at 4k.
Aside from when the workload was at its most intense (i.e always!) neither card suffered from abnormal frame variance.
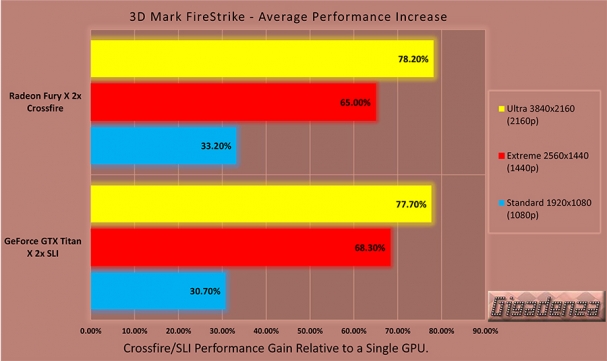
The “average” rise engendered by an additional card was established by adding up the three figures obtained at each resolution for the “solo” GPU benchmarks, subtracting the totals from their dual GPU equivalents to identify the differences in numerical terms, dividing the remainders by the initial “single card” values and finally, multiplying the results by 100 to convert the increases to percentages.
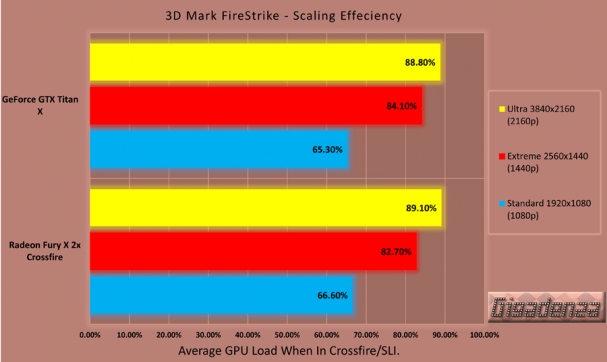
Scaling efficiency was ascertained by dividing the combined scores achieved in crossfire and SLI at each resolution by two, giving us the mean averages for both chips when configured in stereo.
These tallies were, in turn, divided by those calculated from the cards’ corresponding mono runs, which represent our effective baselines and lastly, multiplied by 100 in order to express the former as a percentage of the latter, thereby revealing how effectively the GPUs are functioning as a team.
Not surprisingly, their cohesiveness improved dramatically as resolutions and aesthetics were augmented and despite a smorgasbord of design discrepancies, performance was so evenly matched that one could be forgiven for pondering if Nvidia and AMD were secretly poaching their rival’s driver developers.
Whether true or otherwise, there appeared to be little point in doubling up if you were only partial to recreational relief at 1080p, at least, as far as 3DMark could deduce.
Comparative muscle was measured by combining the three scores attained by both of our pictorial protagonists at 1080p, 1440p and 4k in single and multi card loops, subtracting the lower sums from the higher to discover the overall discrepancy in FPS at each resolution, dividing this figure by the slower card(s) total then multiplying by 100 to determine the faster card’s lead in percentage terms.
Surprisingly, the Titan X’s lead dwindled amidst richer retinal luxuries, firmly laying to rest any concerns over the Fury’s frugal frame buffer…for now
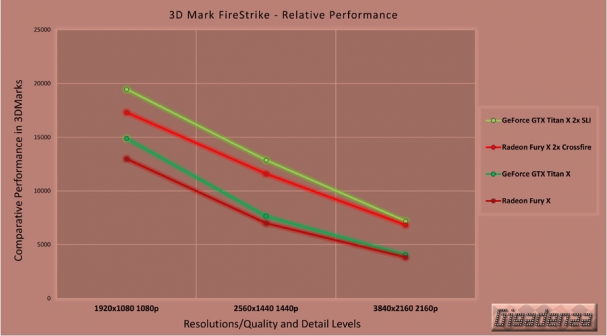
For those who find bar charts profoundly offensive, here is yet another pretentious interpretation of the delicious data at my disposal, perhaps more aptly illustrating how the Fury’s arrears were all but eradicated by the time we scaled the fineries of 4k.
Moreover, AMD’s official projection was spot on regarding its own creation, though research suggests their estimate for the Ti was suspiciously conservative. Ultimately, there’s no pretending this isn’t a clean sweep for the Titanic one, but why dwell on spurious synthetics when a glorious glut of gaming beckons.
Having fried my entire frontal cortex in a frenzied desperation to ensure that these radiant rectangles and luminous lines emanated glowing shafts of enlightening wisdom, I shall not chance to sully their cause with superfluous elaboration. Instead, let us preserve precious hours and permit these glamorous graphs to grant a cornucopia of fruity facts.
I recommend you embrace them as you have tables, they’re truly indispensable.
One need never again wade through such jargon as progressive, decline, variability, percentile, optimal, fast, slightly faster, fastest, a bullet train in a black hole, still not fast enough for me. Woah! Not that fast. Sorry? How fast was that? It doesn’t matter, please, just a fraction slower. What? You mean there is such a thing as an FPS overdose?
It isn’t for me or anybody to judge, and that my friends is a graph’s magnanimous philosophy. Where’s the sense in free speech if nobody pauses to listen? These silent sources of succulent data shall never impose an opinion but rather, communicate all that is necessary for you to formulate your own. And frankly, if I am forced to spout any further hyperbole divulging what a quirky collection of colours can clarify in one tenth of the time. I’ll shall see red for the rest of my life.


