

Bandwidth Bemusement
Having already elaborated on the repugnantly contradictory figures relating to the theoretical and actual throughput of PCI-E’s progressive implementations, this paragraph seemed a fitting point to throttle some infuriatingly stubborn loose ends.
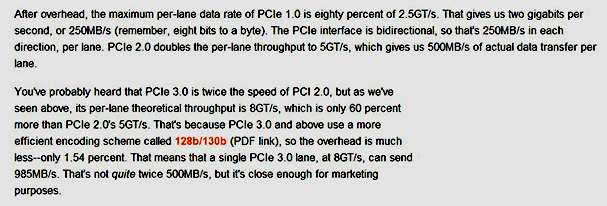
Every incarnation of PCI was subject to what the industry jauntily jargonized as “overheads” which, quite apart from instilling fear in the soul of every entrepreneur’s accountant, compromised the capacity of the interface. These encumbrances were enforced by the imperfect encoding techniques used to exchange data between components.
PCI-E 1.0, 2.0 and SATA utilized an 8 to 10bit procedure, where every 10 bit transmission resulted in only 8 bits of data being broadcast, thereby incurring a net performance loss of 20%. PCI-E 3.0 introduced a much more efficient 128 to 130 bit scheme, which delivered 128 bits of data for every 130 bit transmission and generated a vastly reduced penalty of 1.54%.
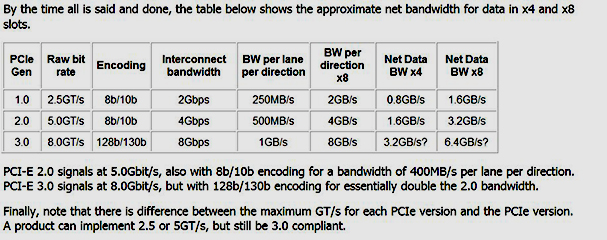
Considering reviewers, manufactures and pundits were notoriously wayward over which values they divulged in specifications, articles and amidst feverish forum fanaticism, the table above is intended to illustrate the correlation of raw data rates to those after the overheads have been deducted
How I pray for the day when neatly framed figures terminally nullify aggravating confusion, for attempting to do so in words is a tricky as reciting Shakespeare in Hebrew, and as pointless as reciting Shakespeare in Hebrew…..backwards.

This analysis of the overheads coincides with the formulae applied in my table. For PCI-E 1.0, 2.0, and 3.0 the figures quoted prior to encoding are 2.5, 5.0 and 8.0 giga-transfers (GT/s) per second respectively for each individual lane. Gigatransfers equate to gigabits, hence these figures can also be interpreted as 2.5 5.0 and 8.0 gigbits per second.
One byte equals eight bits, so to procure the values in bytes, we divide each number by eight, giving us 312.5 megabytes per second/lane for PCI-E 1.0, 625 megabytes per second/lane for PCI-E 2.0 and 1000 megabytes or 1 gigabyte per second/lane for PCI-E 3.0.
Next, we subtract the overheads. 20% taken from 312.5 (for PCI-E 1.0) leaves 250 megabytes or 2000 megabits (8 times 250) or 2.0 gigabits per second/lane. For PCI-E 2.0, the equation is the same, 20% from 625 gives us 500 megabytes or 8000 megabits (8 times 500) or 8.0 gigabits per second/lane while for PCI-3.0, with its refined encoding method, we subtract 1.54% from 1000, leaving us with 984.6 megabytes per second/lane.
Complex, but just about digestible, do we dare glance at the table below?

Let’s try to establish what each column defines and whether or nor the pre and post overhead values are consistent with those listed above.
PCI-E Gen – The generation of the PCI-E interface.
Raw Bit Rate – The data transfer rate per lane in each direction before encoding (in Gigatransfers per second).
Encoding– The encoding scheme employed for the interface.
Interconnect Bandwidth – The data transfer rate per lane in each direction after encoding (in gigabits per second)
BW per lane per direction – The data transfer rate per lane in each direction after encoding (in megabytes per second). This value is obtained by dividing the number in the fourth column by eight
BW per direction x8 – The data transfer rate of an 8 lane slot in each direction after encoding (In gigabytes per second). This value is obtained by multiplying the number in the fifth column by eight.
In the case of PCI-E 3.0, the values in columns 4, 5 and 6 have been rounded to the nearest gigabit/gigabyte due to the overhead of 1.54% being meagre enough for a ravenous corporation to disregard.
Net Data BW x4 & x8 – Net data bandwidth for a x4 and x8 slot in each direction. In mathematical terms, these values are obtained by multiplying the numbers in the fifth column by four or eight (depending on the number of lanes) then subtracting 20% from each result. However, this deduction evidently cannot relate to the encoding penalties as those have already been accounted for.
Note that for PCI-E 3.0, which is only supposed to incur a 1.54% deficit, the anomaly is repeated, with a further 20% going missing in these final two columns for no apparent reason.
Note also that the stated capacity of a single PCI-E 2.0 lane is 400MB per second instead of 500MB as disclosed in in the table, again, 20% less than the value that has already allowed for the overhead and therefore, 40% lower than the lane’s raw bit rate.
I have absolutely no idea when these figures were published, where they fit in, or why they even exist. Painstaking research revealed no explanation, though many sources appear to calculate PCI-E bandwidth in accordance with this formula. Should you stumble upon the critical reason, don’t call me, just subtract an additional 20% from every “post overhead” value listed in my bloody table!